In today's data-driven world, turning complex information into valuable insights is key. This is where Power Query comes into play – a tool that can make your data tasks feel like a breeze.
Think of it as your trusty data sidekick, helping you clean up messy information and turn it into something useful. But Power Query does more than just tidying up data – it's all about making your analyses.
In this guide, we'll break down Power Query step by step, covering everything you need to know. By the end, you'll have the skills to confidently wrangle your data, improve your decision-making, and boost your efficiency like a pro.
What is a Power Query?
At its core, Power Query is like a wizard for your data. It's a powerful tool that makes getting your data ready for analysis a whole lot simpler. Think of it as a bridge that connects different sources of data and helps you clean, reshape, and combine them into a format that's easy to work with. Whether you're dealing with spreadsheets, databases, or web data, Power Query can handle it all. The best part? It's not just a standalone tool – it's seamlessly integrated with popular software like Excel and Power BI.
The interface is of a user-friendly spreadsheet environment, including all the Pivotal elements such as Queries, Steps, and Applied Steps. Queries serve as the foundation, outlining your data transformation blueprint. Each Step represents a distinct action – think filtering, sorting, or merging – that gradually molds your data into its refined form. When you've sculpted your sequence of Steps, you apply them to your data.
How to get started with Power Query?
To integrate Power Query into your Excel or Power BI ecosystem, follow these straightforward steps:
Steps to install Power Query in Excel:
Navigate to the "Data" tab and locate the "Get Data" dropdown menu. Select "Get Data" and choose "From Online Services". A click on "From Power Query" will initiate the installation process. Alternatively, you can download the Power Query add-in from the Microsoft website and follow the installation prompts.
How to get started with Power Query in Power BI?
1. To access the Power Query Editor, choose the "Transform data" option located within the Home tab of Power BI Desktop.

2. Establish a Data Connection with your Power BI.
After establishing a data connection, the Power Query Editor is ready to use.
1. Numerous buttons in the ribbon become operational, allowing for interaction with the data within the query.
2. On the left-hand side, a list of queries is presented, accessible for selection, viewing, and refining.
3. The center section showcases data from the chosen query, ready for further refinement.
4. The Query Settings pane provides a catalog of the query's attributes and executed actions.

For more indepth information related to Power BI, kindly refer to the Microsoft Documentation.
How to connect your data sources for Power Query?
Whether you're pulling information from databases, files, or web services, Power Query is your gateway to efficient data access.
You can connect your data in the following ways:
1. Database Connections: Seamlessly link to your database of choice by selecting the "Get Data" option. From there, choose the appropriate database connector and provide the essential credentials for a secure connection.
2. File Sources: Delve into your files by selecting the "Get Data" option and opting for "File." Depending on your file type – Excel, CSV, or JSON – Power Query accommodates your selection, ushering in a streamlined import process.
3. Web Services: Extend your reach to the online realm by opting for the "From Web" option under the "Get Data" menu. Here, you can input the URL of the desired web service and delve into data acquisition directly from the online domain.
Data Transformation and Cleaning
Refining data granularity is achieved through data filtering and sorting techniques, which are fundamental to organizing and extracting meaningful insights.
Data Filtering Techniques:
Power Query offers several data filtering techniques to help you refine and shape your data. Some of these techniques include:
Auto Filter: Power Query automatically detects and applies filters based on the data in your columns. You can use the drop-down menus on column headers to select specific values for filtering.
Filter Rows: Use the "Filter Rows" option to manually specify filtering conditions based on column values. This can include filtering for specific values, ranges, or text patterns.
Remove Rows: You can remove unwanted rows from your data based on specific criteria using the "Remove Rows" option. This can be useful for excluding rows that don't meet your analysis requirements.
Keep Rows: Conversely, the "Keep Rows" option lets you retain only the rows that match certain criteria. This can be helpful when you want to focus on specific subsets of your data.
Remove Duplicates: Power Query allows you to easily identify and remove duplicate rows from your data. This helps in maintaining data integrity and accuracy.
Filter by Condition: This technique enables you to apply custom filtering logic based on various conditions using formulas and expressions.
Top N/Bottom N: You can use the "Top N" or "Bottom N" filters to keep only a certain number of rows with the highest or lowest values in a column.
Text Filters: Power Query provides text-specific filters, such as filtering by text length, text contains, or text starts/ends with.
Date Filters: You can filter data based on date ranges, specific dates, or relative date calculations.
Custom Column Filters: Create custom columns using formulas that derive values based on existing columns. Then, filter or manipulate data based on these custom columns.
Advanced Filtering: Advanced filtering options include using logical operators (AND, OR) and combining multiple filtering conditions.
Slicers: In Power Query, you can create slicers to allow users to interactively filter and analyze data in the Power BI report or Excel workbook.
Advanced Power Query Techniques
M Language:
The M language, also referred to as the Power Query Formula Language, is the driving force behind the scenes. While not a prerequisite for basic Power Query usage, delving into its nuances empowers you to craft more sophisticated data transformations.
To illustrate the power of the M language, consider a scenario where you need to extract the year from a date column. While this can be achieved using Power Query's graphical interface, M allows you to create a custom expression that achieves the same result.
For instance, the M expression Date.Year([DateColumn]) extracts the year from a date in a column. Similarly, you can use M to perform mathematical operations, concatenate text, and apply conditional logic.
Imagine you have a dataset with a "Product Price" column and a "Discount" column, and you want to calculate the discounted price for each product. Using M, you can craft a custom expression that subtracts the discount from the product price, like each [Product Price] - [Discount].
Phrazor Visual is used on Power BI to generate Narrative Insights on your Power BI Dashboard. With Phrazor Visual, you can customize your insights by setting the objective for your report, Drill down across Hierarchies to see the potential cause behind your visualizations.
For more information regarding the Visual, refer here.
Download now and start your Free trial!
About Phrazor
Phrazor empowers business users to effortlessly access their data and derive insights in language via no-code querying
You might also find these interesting
Recommended Reads

Phrazor Visual Product Update: October 2023
Our latest Phrazor Visual update brings improved language quality, key takeaways, and actionable insights.

Why Phrazor and ChatGPT are a match made in Heaven
Learn how Phrazor SDK leverages Generative AI to create textual summaries from your data directly with python.

What is Power BI DAX - A Complete Guide
Power BI DAX formulas have a well-defined structure that combines functions, operators, and values to perform data manipulations.

How to Create a Data Model in 6 Simple Steps
Learn the basics of how to create a working data model in 6 simple steps.

Create Tableau Heatmap in simple steps
Heatmap transforms data into a vibrant canvas where trends and relationships emerge as hues and intensities. In this blog we will learn how to create a heatmap on Tableau in easy steps.

Top 7 Tableau tips and tricks for Tableau developers
Supercharge your Tableau reports with our seven expert Tableau tips and tricks! We will share tips on how to optimize performance and create reports for your business stakeholders.
What is Data Catalog and how to implement it
Data Catalog is an organized inventory of an company's data assets, providing a centralized repository that facilitates data discovery, understanding, and management.
Top 7 Power BI tips and tricks for Power BI developers
Supercharge your Power BI reports with our seven expert Power BI tips and tricks! We will share tips on how to optimize performance and create reports for your business stakeholders.

Generate Smart Narratives on Power BI
Learn the smarter and easier way to generate Narrative Insights for your Power BI dashboard using the Phrazor Plugin for Power BI.

5 Common BI Reporting Mistakes to Avoid
Learn how to avoid the top common BI reporting mistakes and how to leverage your data to the maximum usage.

5 Ways to Improve Your Business Intelligence Reporting Process
Learn how to establish a consistent reporting schedule, work on data visualization, automate data collection, identify reporting requirements, and identify KPIs and metrics for each report.

Automate your talent acquisition report with Phrazor
Discover how to enhance your talent acquisition reporting with BI tools like writing automation and NLG. Learn about Phrazor’s capabilities and its integration with Power BI.
Benefits of Automated Financial Reporting for Enterprises
Learn about the benefits of automated financial reporting and the role of natural language processing (NLP) in its success in this informative blog.

How Phrazor eliminates ChatGPT's data security risks for Enterprises
Learn how Phrazor enhances data security for enterprises by separating sensitive information from ChatGPT's queries. Generate insights with confidence.

Supply Chain Analytics and BI - Why They Matter to Enterprises
Learn how supply chain analytics and business intelligence (BI) can help organizations optimize their operations, reduce costs, and improve customer service.

How Phrazor leverages ChatGPT for Enterprise BI
Discover how Phrazor, an enterprise business intelligence platform, harnesses the power of ChatGPT, a large language model, to generate insightful reports and analyses effortlessly. Learn more about the benefits of using Phrazor's AI-powered capabilities for your business.

The Future of BI Reporting - Trends and Predictions for 2023
Explore the new trends and predictions for the Business intelligence Industry and How AI is disrupting the BI industry and the traditional methods.

Narrative Science has Shut Down. Here's an Interesting, and Similar, Alternative For It
If you're a Narrative Science customer, you may have recently found yourself in a tough spot. In December 2022, Narrative Science was acquired by Salesforce for Tableau, and their services have now been stopped. So where does that leave you?

Why it Makes Sense for Small Enterprises to Opt for Self-Service BI Early
If we are to learn from the best, it’s evident that data is the fuel to propel your growing organization to greater heights. Google used what is termed ‘people analytics’ to develop training programs designed to cultivate core competencies and behavior similar to what it found in its high-performing managers. Starbucks...

Improving Dashboard Functionality Through Design
A look at the multiple design and customization options Phrazor provides to dashboard creators, to help drive engagement, adoption, and more.

Conducting Advanced Conversational Queries on a BI Tool Effortlessly
Natural Language Querying, or NLQ, is one of the primary methods through which a business user can synergize his vast experience and answers from the company’s data to arrive at the best decisions, without wasting time on either learning or executing anything new.

How Pharma can Optimize Sales Performance Using Business Analytics
The Pharma play is smartening up with automated insights to drive effectiveness in Sales and Marketing efforts.

Leveraging Sales Analytics to Gain Competitive Advantage
Learn how Analytics is shining the light on your sales data to stay ahead of the game.

Impact of Good Insights in Business
Why do managers not use data or insights? Can insights be bad? What is a good insight? Read on for answers.

How Marketing Analytics Optimizes Marketing Efforts
Know for sure if your marketing efforts are hitting bullseye or missing the mark.

How HR Analytics can find the Right Talent and drive Business Productivity
Gain complete visibility of the human resource lifecycle to drive business value.

Business Intelligence vs Data Analytics vs Business Analytics
What is the best fit for your business needs? Let’s find out.

Applications of NLQ in Marketing
NLQ holds the potential to completely revolutionize the way the marketing department works, helping them improve lead generation, measure campaign performance, sift through web analytics, and create effective content.

Does Your BI Tool Have These 4 Must-Have Features?
Although BI tools are being widely indoctrinated into a company’s tech arsenal, its usage and adoption still leaves a question mark on the validity of the BI investment made. Some of the common reasons why Business Intelligence tools are not being adopted company-wide are:
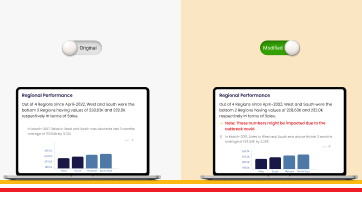
Taking Collaboration To The Next Level With Modified Reports
Phrazor provides a simple solution: create an additional, ‘modified’ report that holds all your comments and edits, without altering the original report whatsoever.
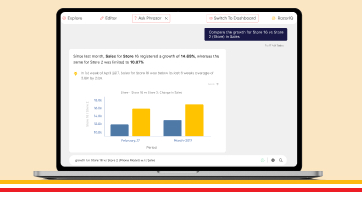
How To Create A Dashboard By Just Chatting - In 4 Steps
Due to the cumbersome process of communicating with tech teams, business users have to wait for weeks or days to get even ad-hoc queries answered. The dependency on data analysts is just far too great. Additionally, most dashboards in use today are of a static nature..

Why Narrative-Based Drill-Down is Superior to Normal Drill-Down
Narrative-based drill-down helps achieve the last-mile in the analytics journey, where the insights derived are able to influence decision-makers into action. Let’s understand how narrative-based drill-down works through a real example...

Why Phrazor’s Conversational Analytics Chatbot is a Cut above other Chatbots
The querying capabilities of Ask Phrazor when compared to the other solutions available in the market, those from Tableau and Power BI, for instance, leave clear daylight between Ask Phrazor and the others. Here are 5 features that showcase how Ask Phrazor is a cut above the rest:
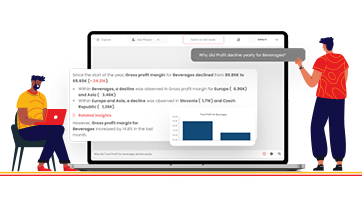
Don’t Ask Your IT Team, Ask Your Data - Dashboard Conversation Interface for Business Users
Conversational analytics on dashboards for business users means they can conduct queries and ad-hoc queries on dashboards in real-time, without the need to revert to tech-based teams and wait for days or weeks for reverts.

Self-Service BI - The Way Forward For Both Analysts and Business Users
The most important question that business users should be asking when making important decisions is this: does my dashboard enable me to take decisions independently?

5 Top Management Reporting Expectations And How To Meet Them
Reports created for the top management do not fulfill their purpose of being useful in strategic decision-making. So what are the top management reporting expectations, and how do you meet them? Read on:

How Phrazor Helps Improve Sales for the Pharmaceutical Industry
Each report is embedded with language-based insights that make data easy to interpret. These auto-generated insights not only explain the data visible on the dashboard but also mine the underlying data pool to surface hidden insights that would have gone completely unnoticed otherwise.
Here’s why you need to add a Language Extension on Tableau
Even though Tableau Dashboards are loaded with exciting features, and new ones constantly added, organizations cannot justify the cost of acquisition of such high-investment BI Tools due to their inability to contribute to ROI. In other words, business owners are not always able to use dashboards to arrive at all-important decisions.

Why should the Financial Services Industry invest in a Self-Service BI Tool
One would conclude that while there is nothing wrong with traditional BI tools, it is the evolution of data in terms of size and complexity and how organizations use it today that necessitates analytics which is beyond the scope of traditional BI tools.

How a Self-Service BI Tool can help the Financial Services industry in Market Intelligence Reporting
Market intelligence reports are to enhance your business intelligence and decision-making. Self-service BI tools can help financial service providers expand their offerings, discover unexplored markets, become more efficient.
Are your dashboards failing to perform? 10 ways to make your dashboards perform optimally
Dashboards curate comprehensive data analysis and enable users to customize the information they want to be displayed. This article describes the reasons why dashboards seem ineffective and how you can avoid these problems.

Data Storytelling: Communicate Insights from Business Data Better with Stories
Data-driven storytelling makes data and insights more meaningful. This article describes the need for data storytelling, how it impacts businesses and helps in improving the communication of insights.

Why Augmented BI is a must-have for your business?
Learn how Business Intelligence has evolved into self-service augmented analytics that enables users to derive actionable insights from data in just a few clicks, and how enterprises can benefit from it.

How is Natural Language Generation Enhancing Processes in the Media & Entertainment Sector
Natural Language Generation plays a vital role for media and entertainment companies to create the right customer experience. It improves processes, boosts customer engagement, and gain a competitive advantage.

Making Sense of Big Data with Natural Language Generation
Businesses often face challenges in combing and mining the right data and translating it into useful and actionable insights. NLG uses the power of language to automate this process and bridge the gap. Read this article to find out how NLG can be effectively used to analyze big data.

How Natural Language Generation is Transforming the Pharma Industry
Natural Language Generation is transforming the pharma industry by increasing the efficiency of clinical trials, accelerating drug development, improving sales and marketing efforts, and streamlining compliance.
Introducing Phrazor: Everything you Need to Know About This Smart BI Tool
Meet Phrazor, our self-service BI platform that turns complex data into easy-to-understand language narratives.

Taking Financial Analysis and Reporting to the Next Level with Natural Language Generation
NLG in finance simplifies data management by automating time-consuming and repetitive workflows and increasing the speed and quality of analytics and reporting.

Phrazor Automates Commentary on IPL Matches for a Leading Media & Publishing Company
Phrazor collaborates with Hindustan Times and ventures into a new product use case, wherein it can help publishing companies and journalists in automating written content.

Going beyond Business Intelligence with Augmented Analytics
Explore how business intelligence systems have evolved into augmented analytics, allowing businesses to become smarter and more proactive.

How is Reporting different from Business Intelligence?
Discover the nuances of reporting, business intelligence, and their convergence in business intelligence reporting.

The art of Data-Driven Storytelling - What is it and why does it matter
Learn why data-driven storytelling, and not just data analytics is necessary to drive organizational change and improvement.

How Big Data Analytics aids Media & Entertainment
Discover how big data analytics is helping media companies to maximize their entertainment value and enhance their business performance.

Applications of AI in the media & entertainment industry
From the way creators conceptualize media content to the way consumers consume it, AI is seeping every aspect of the media and entertainment industry.

How Natural Language Generation Is Helping Democratize Business Intelligence
Discover the role of natural language generation in democratizing business intelligence and building a fully data-driven enterprise.

It's time to upgrade your BI with natural language generation
Learn how natural language generation can help organizations extract the maximum value from their business intelligence tools.

How AI can add value to Human Resource Management
Explore the different ways enterprises can use artificially intelligent automation for HR functions.

How AI is Transforming HR Management
See how AI-enabled HR automation is helping enterprises to enhance the end-to-end employee lifecycle.

4 Ways Big Data Analytics is Revolutionizing the Healthcare Industry
Learn how the use of big data is impacting the different aspects of healthcare, from diagnosis and drug discovery to treatment and post-treatment care.

The Role of NLG-based Reporting Automation in the Pharma Industry
Explore the leading present-day use cases of natural language generation-driven reporting automation in the pharmaceutical industry.

Develop a data-literate enterprise with NLG
Learn how Natural Language Generation (NLG) technology can aid in achieving data literacy across your enterprise to enable data-driven decision making.

Data literacy - the skill growing enterprises must watch out for!
Discover why enterprises must understand data literacy and its importance to be prepared for the data-driven future.

Giving Financial Reports a Facelift with Reporting Automation
Discover how financial institutions are leveraging artificial intelligence and machine learning-enabled natural language generation tools to automate their reporting processes.

Automation in Banking and Financial Services: Streamlining the Reporting Process
Explore how the Banking and Financial Services industry is making the most of automated reporting.

Personalize your Portfolio Analysis Reports for unique Customer Experience
Learn how to capitalize on creating a unique customer experience for your investors with personalized portfolio analysis reports & natural language generation.

Simplifying Portfolio Analysis Reports using Automation
Here’s how reporting automation is changing the face of portfolio analysis reporting for better customer experience and understandability.

Predictive Analytics: What is it and why it matters!
Here's how organizations are making the most of predictive analytics to discover new opportunities & solve difficult business problems.

Business Intelligence, the modern way!
Read more to find out the modern approach to Business Intelligence and Reporting

How AI is transforming Business Intelligence into Actionable Intelligence
Check out how advanced AI technology like Natural language generation is transforming BI Dashboards with intelligent narratives.

Data summarization – the way ahead for businesses
Here's how proper summarization and analysis of data can help increase business value and ROI.

NLG modernizing businesses!
Here's how leading businesses are approaching reporting and analytics using advanced artificial intelligence like Natural Language Generation (NLG).

Demystifying Big Data Analytics
Read more to find out how Big Data Analytics can help businesses recalculate risk portfolios, help detect fraudulent behavior, and determine the root causes of failures and defects in near real-time.

Business Intelligence Decoded
Business intelligence is a data-driven process for analyzing and understanding your business so you can make better decisions based on real-time insights. Here's how it can benefit your teams and organization.

What are Intelligent Narratives and why every business needs them?
Here's how intelligent narratives supplement the graphical elements on dashboards and add more value to the information communicated by giving a quick account of the data, deriving key insights, and aid faster, better decision making.

AI revamping the educational space
Read how AI and machine learning are paving their way in the educational space by overcoming the traditional challenges of the industry.

vPhrase emerges as the winner at the Temenos Innovation Jam in Hong Kong
Here's how Phrazor demonstrated its capabilities of auto-generating a full-fledged report in just 5 seconds and won the Temenos Innovation Jam in Hong Kong.

Can software write content for you?
Let's understand how and why website and blog content can be auto-generated using Phrazor

The media and entertainment industry goes gaga over AI
Read along to understand how AI is influencing the media and entertainment industry.

AI to revolutionize the banking sector
Here’s how AI is coming to become the most defining technology for the banking industry.

Business problems that AI can solve
Unleash the potential of AI to overcome business challenges and climb higher up the ladder of success.

NLU vs NLP vs NLG: The Understanding, Processing and Generation of Natural Language Explained
Read along to understand the difference between natural language processing, natural language understanding and natural language generation.

AI is all set to empower medicos
AI is a boon to the healthcare industry. Let us understand how it can help medical professionals do their jobs better.

Top use cases in automated report writing
The power of natural language generation in robotizing report writing should be realized in different fields. Here’s why and how.

Striking a chord with your customers, the AI way
Here's how AI-backed solutions can help finance companies improve their customer service with language-based portfolio statements.

Will automation lead to mass unemployment?
Will this wave of Artificial Intelligence and Robotics cause mass unemployment or will it in fact create more jobs? Let's find out...

Leveraging Artificial Intelligence to augment Big Data Analysis
Check out how the painstaking tasks of analyzing massive volumes of data and generating reports can be automated for a boost in productivity and revenue.

5 technological breakthroughs that will benefit your business right away
Do more with less with these 5 tech breakthroughs which you can implement in your business right away.
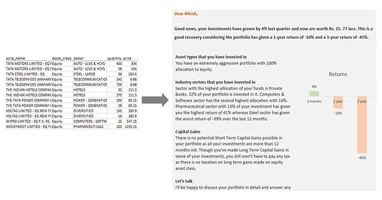
When indecipherable numerical tables turned into personalized investment stories
Natural Language Generation systems help you convert complex portfolio statments in easy to understand investment stories. Read the article to check an example and also how it's done.
A Quick Guide to Natural Language Generation (NLG)
Natural Language Generation (NLG), an advanced artificial intelligence (AI) technology generates language as an output on the basis of structured data as input.

Artificial Intelligence Decoded
Artificial intelligence (AI) is a field of computer science focused at the development of computers capable of doing things that are normally done by people, things that would generally be considered done by people behaving intelligently.

What is Big Data and how to make sense of it?
Big Data can be described as data which is extremely large for conventional databases to process it. The parameters to gauge data as big data would be its size, speed and the range.

Would you please explain it in human
Phrazor, an augmented analytics tool uses advanced AI technology and machine learning to pull insights from raw data and present them in simple and succinct summaries, augmented by visuals.


